4 Getting started
4.1 Installing packages
If you have installed ggplot2 and ggpubr packages already, you can jump to the next step.
4.2 Loading packages
Load the packages for today’s seminar.
Note: Once you have loaded the package successfully, there will be a check mark display before the package under your packages tab at the bottom right pane.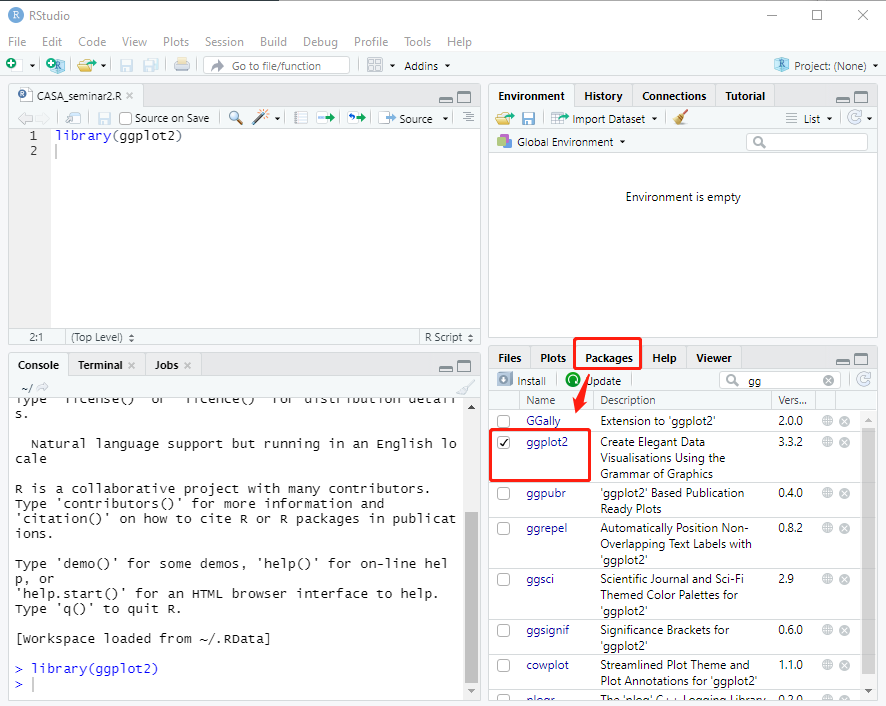
4.3 Dataset
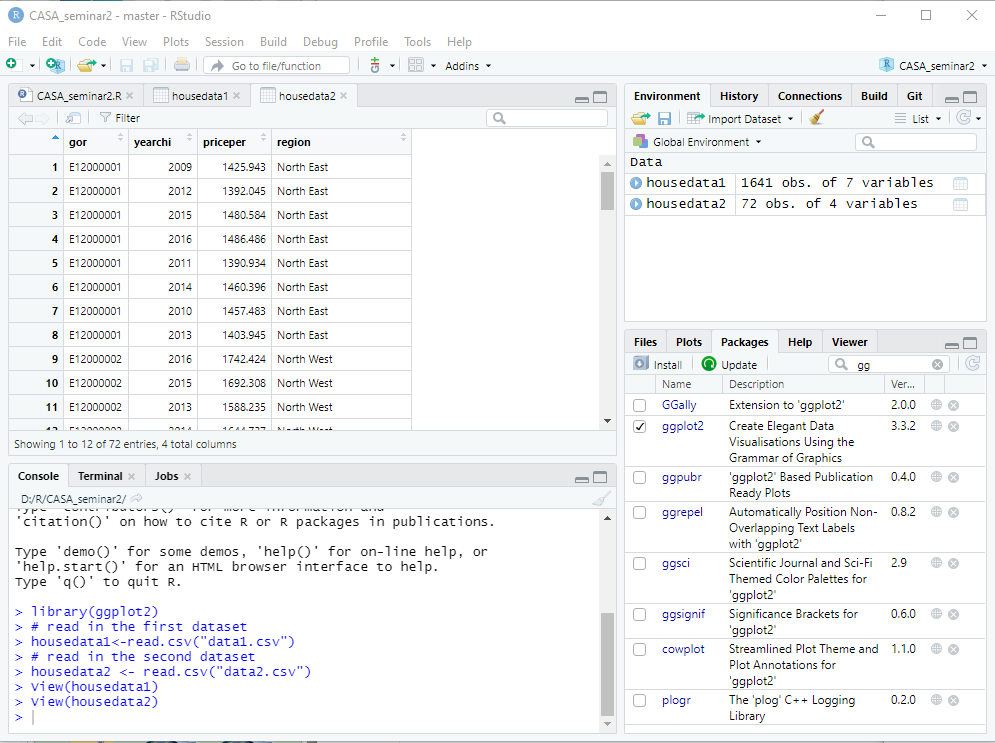
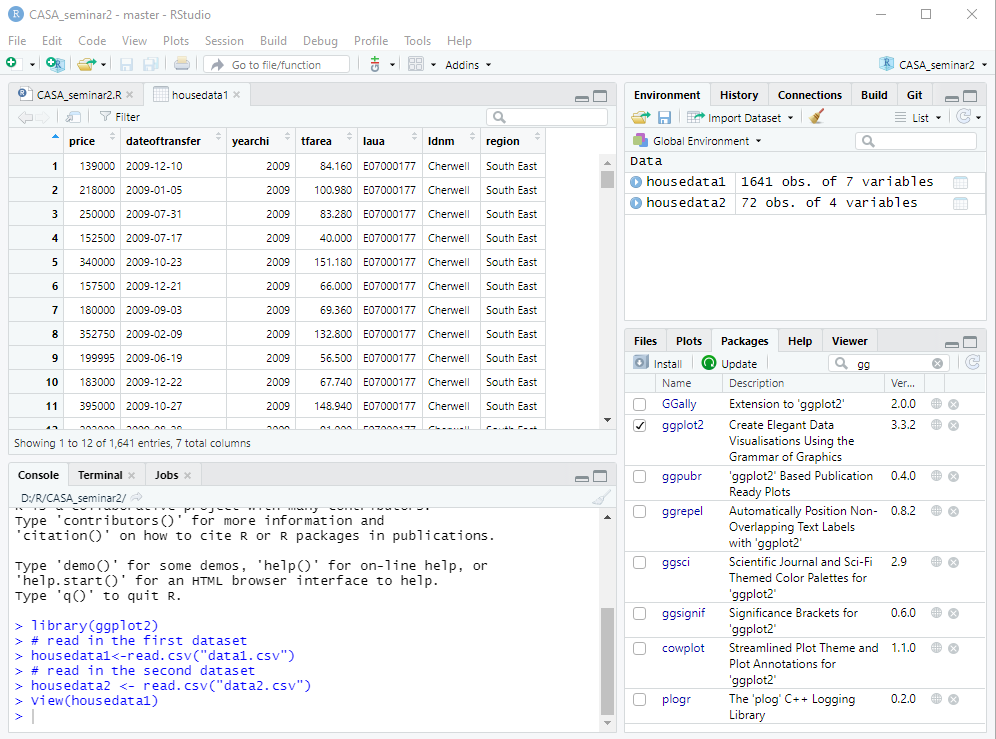
Let’s start by loading two datasets. The first dataset records 1641 housing transactions in 2009 for two local authorities in England. The second dataset records the median house price per square meter for each region in England between 2009 and 2016. These two datasets are derived from a linked house price in England (CASA working paper213).
# read in the first dataset
housedata1<-read.csv("data1.csv")
# read in the second dataset
housedata2 <- read.csv("data2.csv")
The first house price dataset contains seven fields. They separately refer to transaction price, transaction date, transaction year, property’s total floor area, the Census 2011 local authority district code, the Census 2011 local authority district name and region name.
The second house price dataset contains four fields. They separately refer to the Census 2011 region code, transaction year, house price per square meter and region name.